


🐾Improving Glue performance and cost🐾
🤓 AWS Glue is a good choice for serverless data pipelines — flexible, fully managed, and easy to connect with other AWS services. But it’s also easy to overspend if you assume it works optimally out of the box. The truth is, Glue can be very efficient — but only when correctly configured.
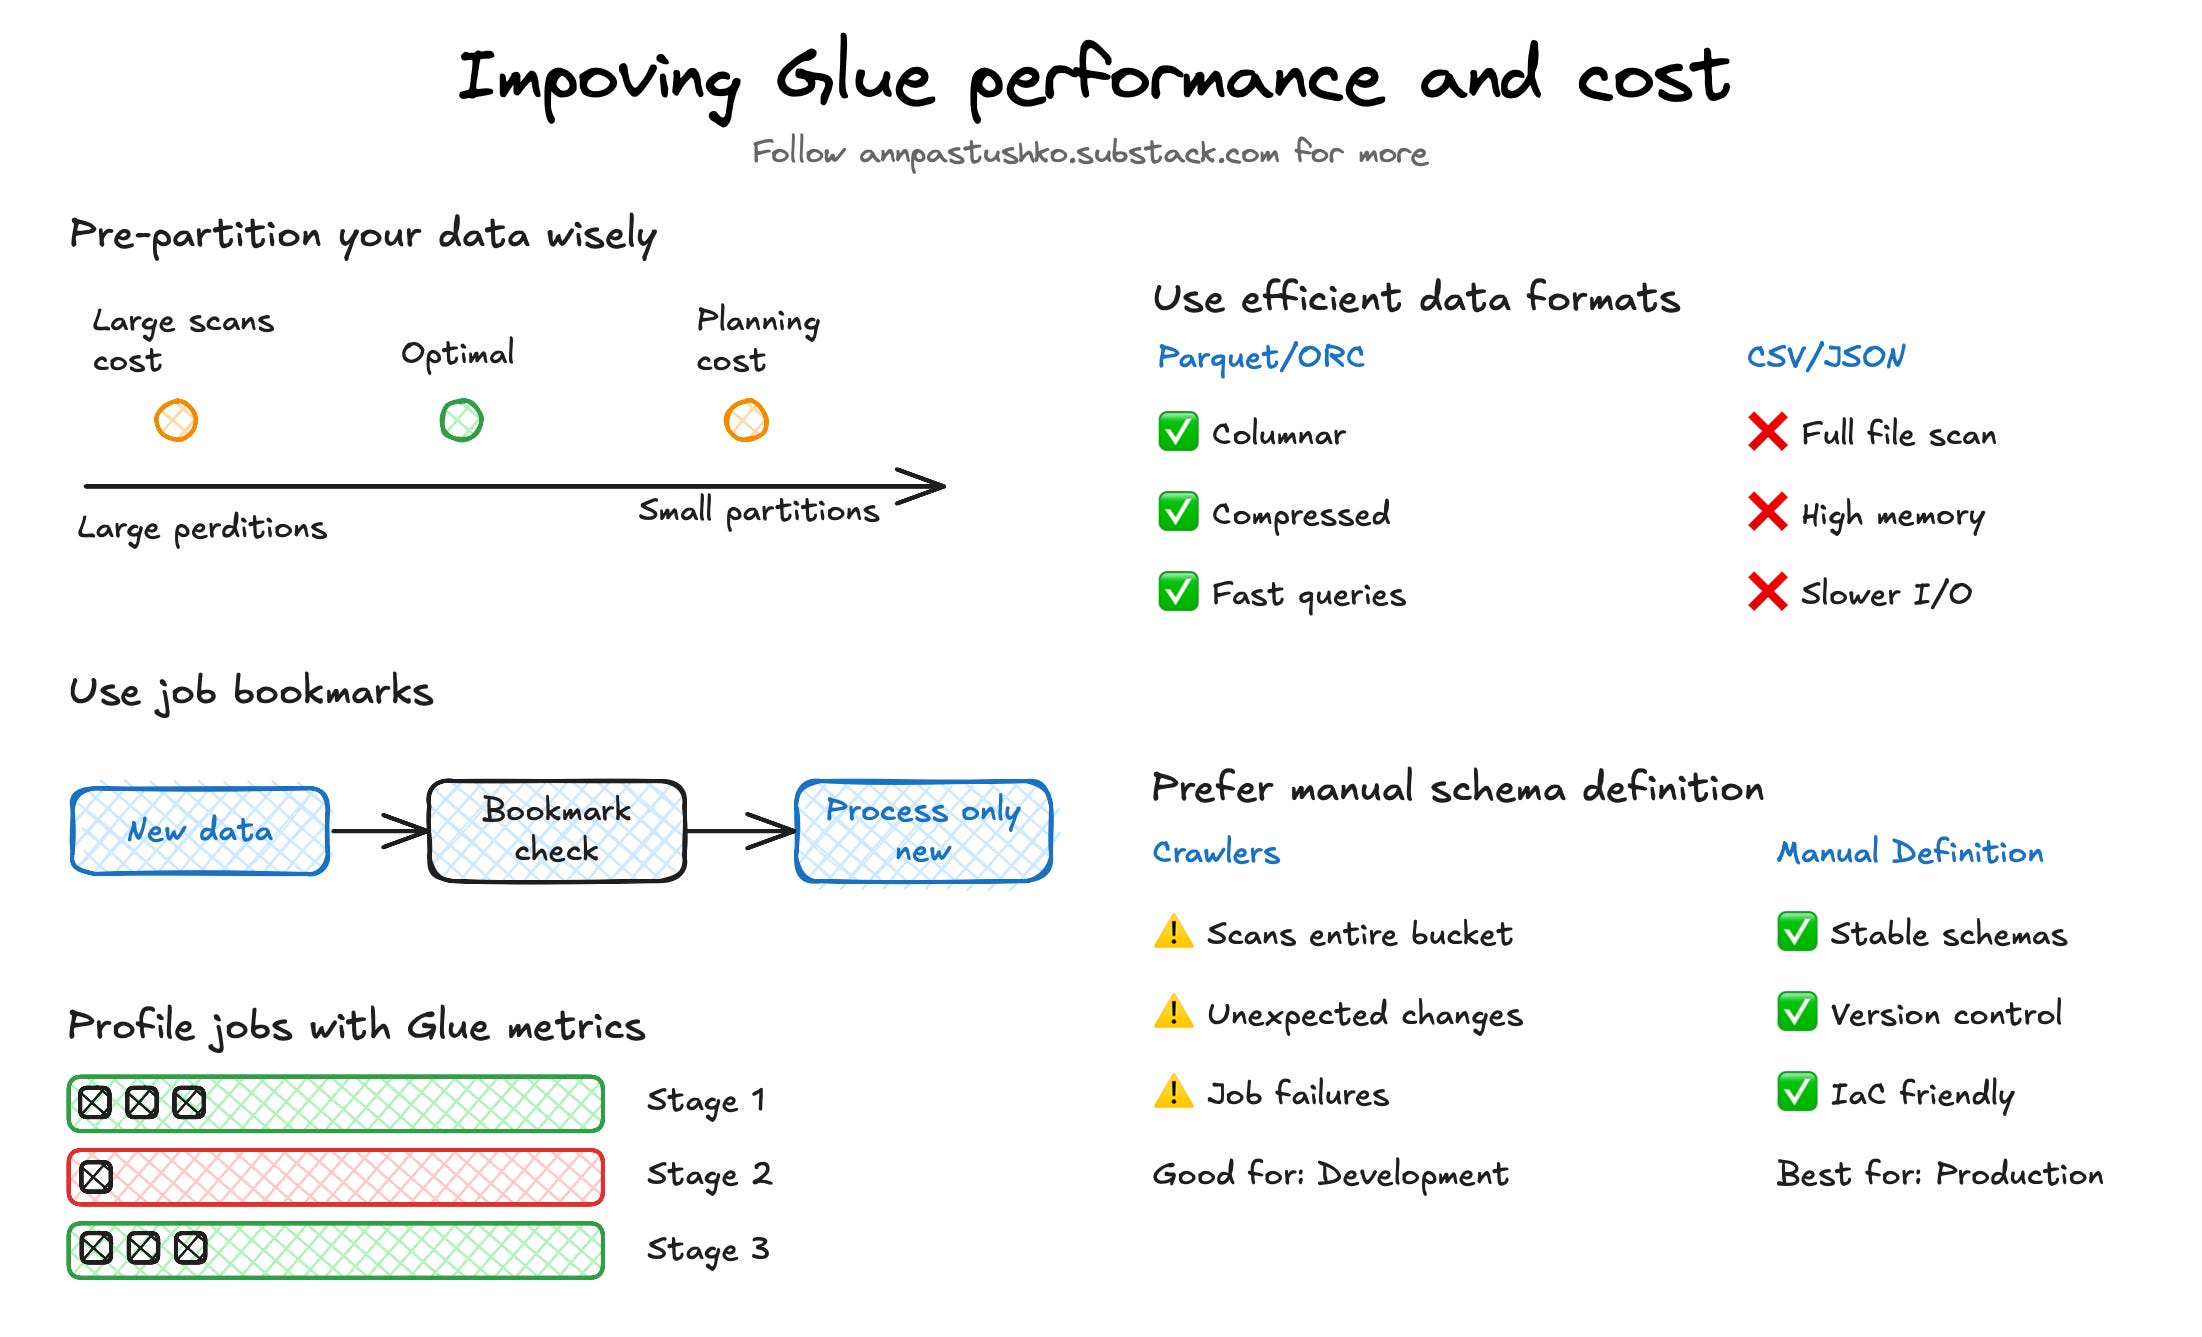
Pre-partition your data wisely
Partitioning improves performance by limiting how much data Glue needs to scan. But the balance matters. Too few partitions — and every job reads more than it should. Too many — and Glue spends excessive time planning the execution. Some jobs with hourly partitions can take minutes just to initialize.
Start with daily partitions unless there’s a clear reason to go finer. Monitor planning time, file counts, and actual query filters. If you're rarely querying at the hour level, use less granular partitions.
Use job bookmarks
By default, Glue reprocesses everything — even data that hasn’t changed. This adds unnecessary runtime and cost as your dataset grows. Job bookmarks help avoid that by tracking what’s already been processed and skipping it in future runs. Make sure your data is stored in a predictable, timestamp-based structure to take full advantage of this feature.
Use efficient data formats
Glue performs best with columnar formats like Parquet or ORC. Text formats like CSV and JSON force Glue to scan entire files and consume more memory, which directly increases DPU usage and cost. Converting raw data to Parquet early — ideally before it reaches Glue — can reduce job runtimes significantly. It also improves performance in Athena, Redshift Spectrum, and other services that rely on efficient I/O. If you're dealing with large datasets, this one change can make a noticeable difference.
Prefer manual schema definition over crawlers
Crawlers are convenient for schema discovery, especially in early development. But in production, crawlers can cause issues by scanning entire buckets even when only part of the data has changed and making schema updates based on unexpected or inconsistent files. This can lead to broken jobs, data quality problems and increased cost. While Incremental Crawls can limit the amount of data scanned by tracking new or modified files, they don’t eliminate potential schema updates issues.
Defining schemas manually improves stability, simplifies versioning, and makes deployment through infrastructure as code much easier.
Profile jobs with Glue metrics
Slow Glue jobs aren’t always caused by large input sizes. Often, one stage dominates the runtime due to issues like skewed joins, inefficient partitioning, or memory pressure causing spills to disk. These problems increase DPU usage and cost significantly. To identify bottlenecks, review Glue job metrics in CloudWatch and Glue Insights metrics. For example, a single skewed join key can cause one executor to handle most data, delaying the entire job.
Understanding of Glue metrics allows you to target optimizations — such as adjusting partition strategies, or increasing executor memory —reducing job duration and overall cost without guesswork.
Thank you for reading, let’s chat 💬
💬 Have you ever run into issues with too many or too few partitions?
💬 Do you rely on crawlers or manual schema management?
💬 What’s the most surprising cost spike you've seen in a Glue job?
I love hearing from readers 🫶🏻 Please feel free to drop comments, questions, and opinions below👇🏻
