🐾Log like a Pro: The Art of structured logging🐾
❓Are print or logging libraries with plain text output sufficient for your Python applications running in the cloud?
✅ The short answer is no. Plain text output may appear human-readable and convenient at first glance, as most logs messages are intended for reading by humans. But such messages are difficult to interpret and analyze programmatically, because you need complex regular expressions to parse them. Also, such logs are inconsistent: values can show up randomly, and the format may change over time.
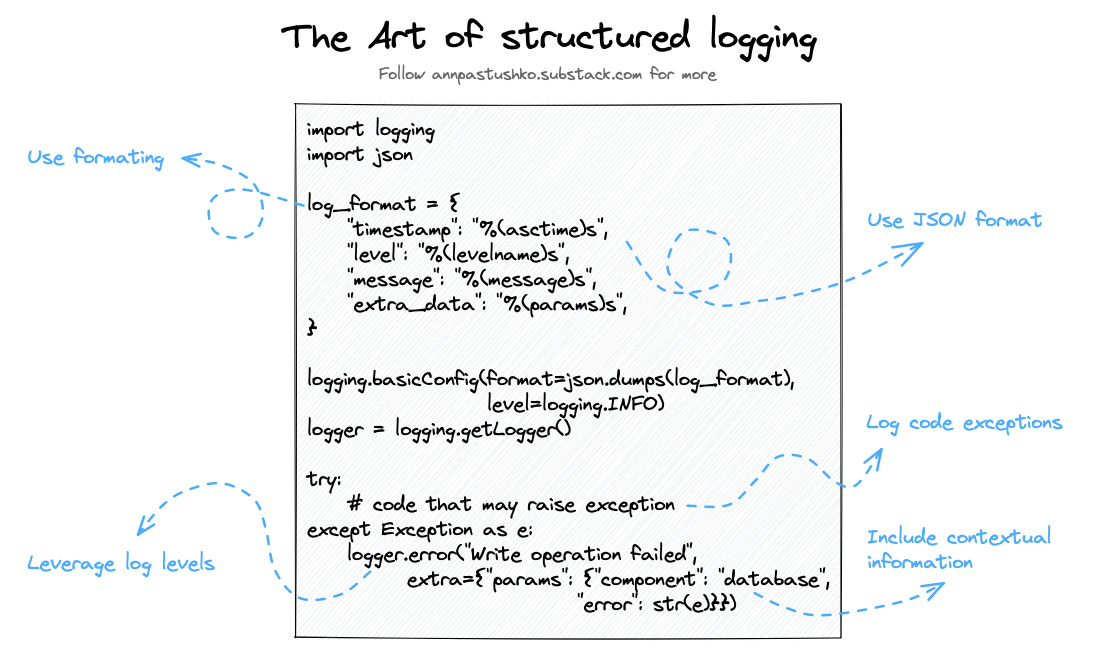
So, there are 5 simple rules to make your logs look like an art:
1️⃣ Use JSON format
Opt for JSON format as it is widely used and supported across different logging services. CloudWatch Logs Insights automatically discovers values in JSON which makes querying and filtering simple.
2️⃣ Customize log formatting
Customize log formatting to suit your needs: choose timestamps format, . It helps to automate reports creation, as log parsing becomes unified.
3️⃣ Leverage log levels
Use different log levels (e.g., INFO, DEBUG, ERROR) to categorize log messages based on their importance. It helps filter logs quicker for debugging purposes and automate report creation based on log level.
4️⃣ Include contextual information
Enhance your log messages by including contextual information like request IDs, user IDs, or any other relevant data. This information makes it easier to trace and diagnose issues.
5️⃣ Log code exceptions
When handling exceptions, include information about the error, such as the exception type, error message, and relevant stack trace. This can significantly improve speed in debugging and troubleshooting.
By following these tips, you'll transform your logs into ones that are easy to filter, analyze, and diagnose issues.
If you like this post, you can share APAWS newsletter with friends:


